WildMetrix Features and Capabilities
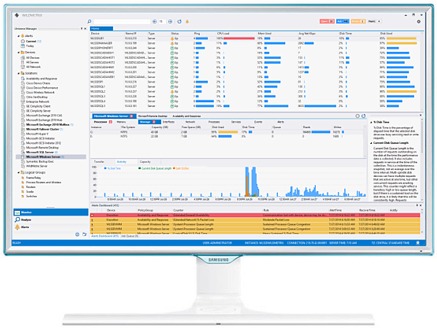
WildMetrix enables professionals with real-time decision support to quickly isolate and remediation of impacting issues. With a live streaming architecture, contextual drill down dashboard framework and correlation across the entire stack, WildMetrix provides t he needed unified insight at the right time.
Benefit Summary
- Optimize Performance - Pinpoint the areas of under-performing and faulty applications across the entire technology stack within a highly optimized single pane of glass user experience.
- Improve Service Reliability - Pinpoint the root cause of critical problems 70% faster and uncover issues not normally detected by other disconnected tools.
- Enhance IT Responsiveness - Deploy solution packs developed for specific products, roles, and features. Extensibility features to build solutions for custom applications and legacy systems.

WildMetrix provides professionals with high performance capabilities not found traditional application and network management solutions
Solution Packs
WildMetrix Solution Packs contain the necessary settings and dashboards to monitor platforms, applications, and networks in a single rapid deployment package. Solution Packs can be customized to your prefrences and facilitates creating new solutions for your custom applications. Additional Solution Packs can be found in the Online Library or from our strategic partners.
Real-time Problem Solving
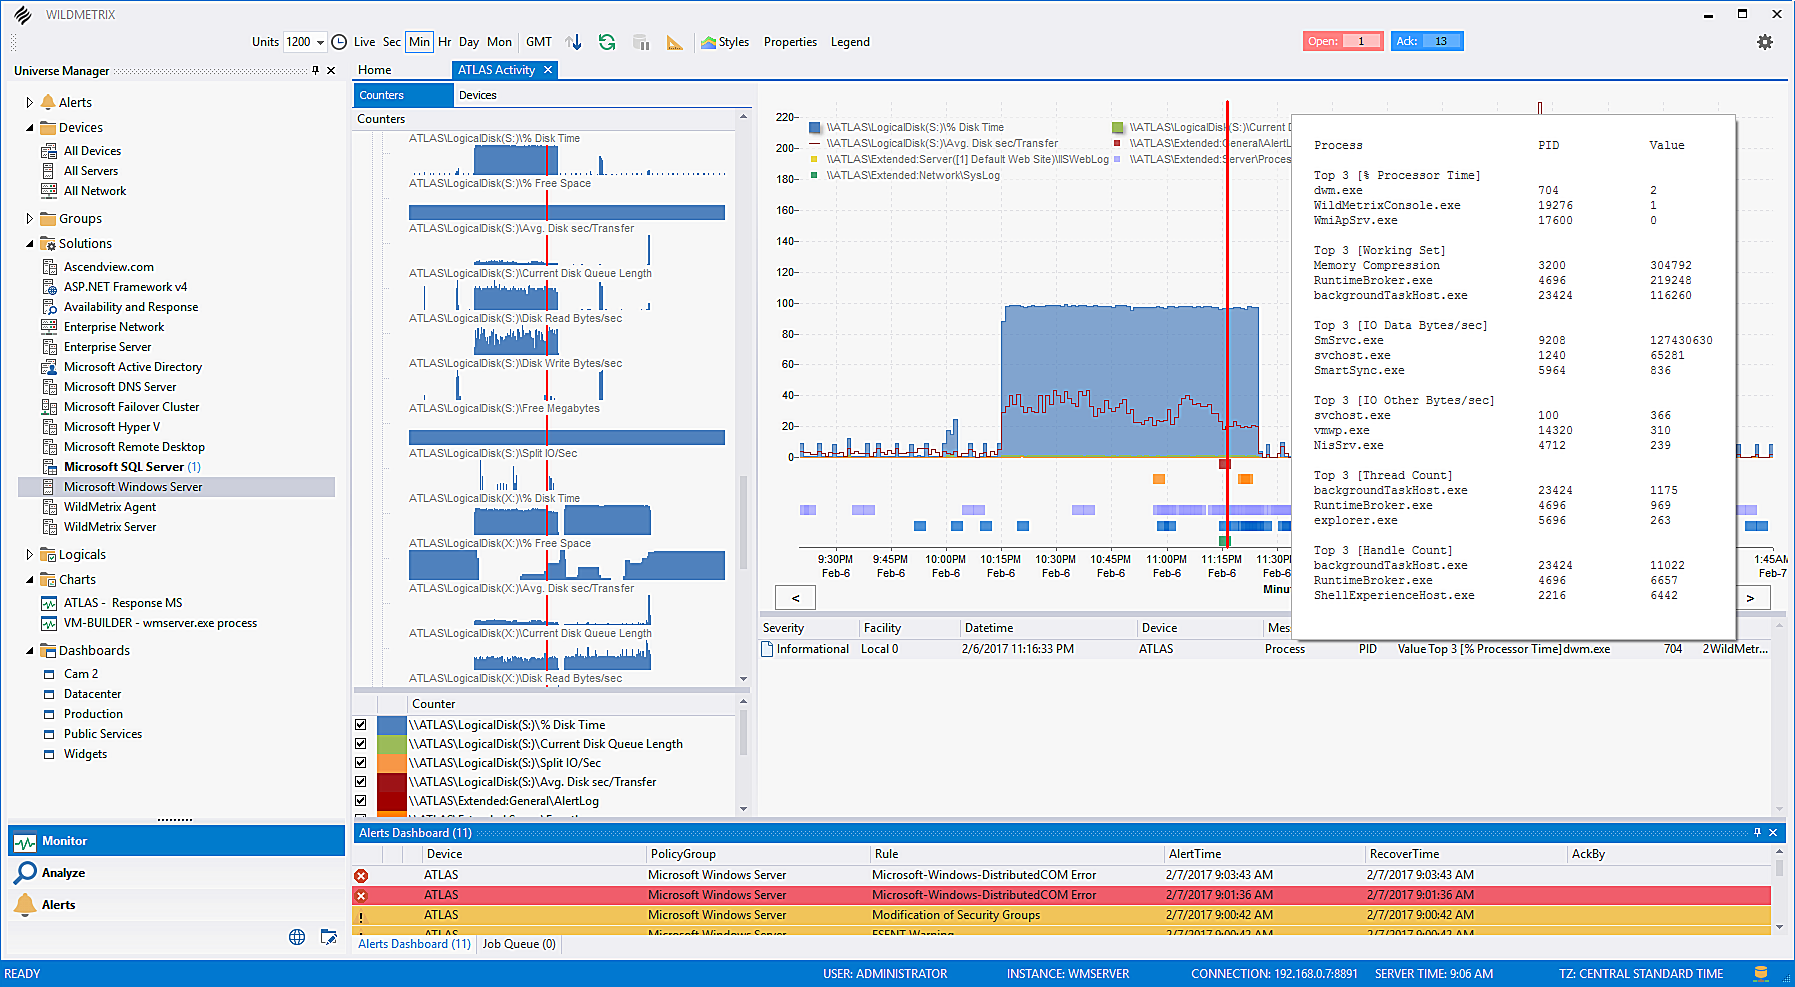
WildMetrix is built with one thing in mind, solving problems. WildMetrix starts with adjustable data collection intervals, down to one second. With support for correlation from log and metric data on a single chart, visual root cause provides insight into ongoing issues that can cause lower than expected service levels. Here are a few of the real time things you can do with WildMetrix...
- Correlate performance metrics, fault and log data from an data source such as web services, databases, custom scripts for aggregating and logging any requirement.
- Correlate any process starts and stops with spikes or drops of any performance metric on any device.
- Correlate any event log entry with any performance metric on any device such as connections or application pool workers.
- Correlate long running pages, high web connections and web requests with sql counters such as batch requests and wait states.
- Correlate security events from security logs and security appliances with process start, stops, connections, and faults.
 Identifying the process causing high disk activity.
- Monitor each page of a website for long running, protocol errors, and unwanted query requests.
- Identify long running page requests in the IIS pipeline that can be causing poor user experience.
- Identify long running and frequent sql queries that potential slow applications creating poor user experience.
- Identify high sql wait states and the source for delayed execution of queries.
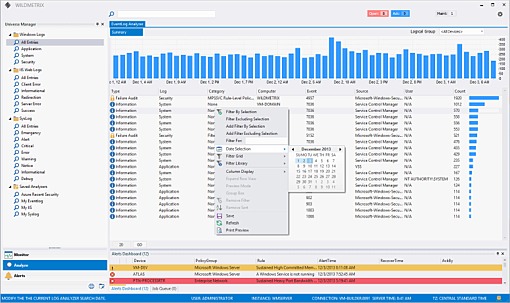
 Identify trends in log data across the entire enterprise
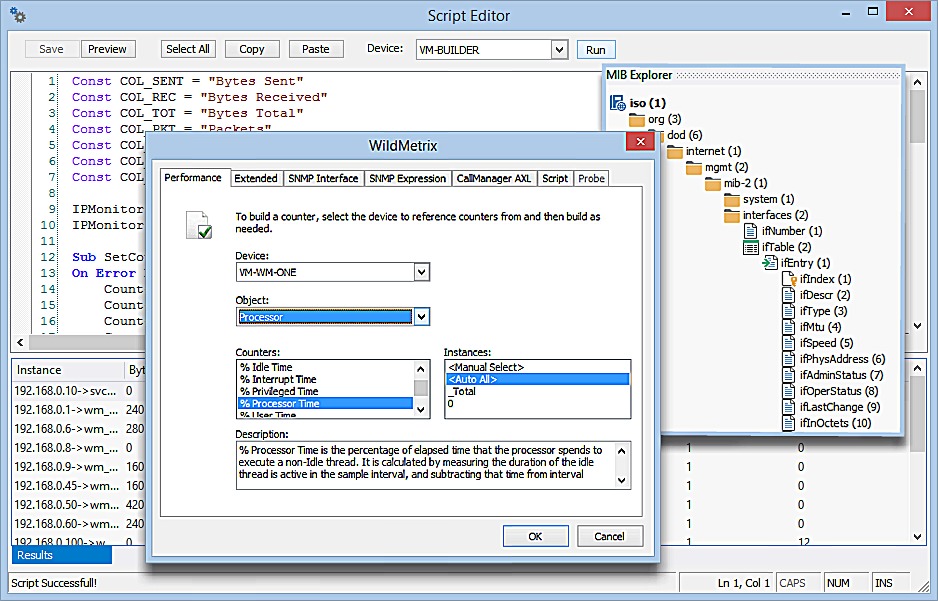
- Create performance counters from any single or combination data source including web services, databases, wmi objects, etc.
- Create performance counters using SNMP expressions across MIB parent-child tables for higher level grouping and appending extended fields into aggregated values.
- Create dashboards for “At-A-Glance” scenarios and Solution Packs for ease of management and distribution.
 Extensibility to monitor everything that matters
Additional Features & Capabilities
- Single agent installed either local or remote
- Very low resource utilization
- Based on thresholds, baseline deviations, and log data
- User acknowledgment system
- Distribution through publication and subscriptions
- Scheduled blackouts and maintenance mode
- Drill down contextual interface
- Corrective actions such as restarting application pools, services, killing processes, and customizable via scripting
- Real-time and historical correlation charting
- Dashboard framework with more than 20 widgets
- Dashboard “At-A-Glance” loop mode
- Integrated Log Analyzer
- Integrated MIB Browser
- High Performance Windows Perfmon Library
- Real time Windows Eventlog Collection
- Windows Services State
- Windows Processes Performance, net connections, and starts/stops
- Windows WMI
- Real time Windows Script Extensibility
- Real time Windows IIS page requests
- Windows IIS Application Pools
- Windows IIS Application Pool Workers
- SNMP Interfaces
- SNMP Expressions
- SNMP Extensibility Scripting
- Real time Syslog Collection
- Cisco AXL and AXL Extensibility Scripting
- Ping and Packet Loss
- Probes for DNS, HTTP, SMTP, SQL, TCP
The WildMetrix Difference
WildMetrix solutions deliver rapid reliability for a larger part of your entire technology stack. It’s native capabilities have been founded around small footprints and real-time data for greater efficiencies. With decision support that unifies all aspects of system, operations and professional teams benefit from having the same information to make informative and quick decisions to increase service reliability.