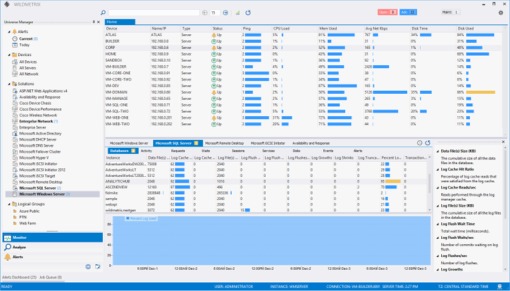
Monitor Microsoft SQL Server
Maximize availability and performance of SQL Server with WildMetrix™
- Helps administrators detect problems in their SQL Server architecture
- Insight into wait states of Disk, Network, Memory, and SQL Server
- Identify blocked, deadlocked and long running queries.
- Review Job Schedules and Job Task History.
- Kill SQL Connections and Restart Windows Services from the console.
- Extend monitoring and dashboards with any of your favorite scripts.
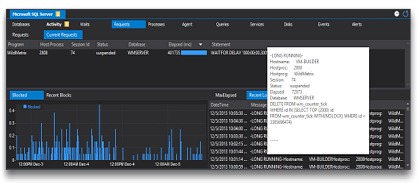
Requests
See currently executing requests, blocked requests, and long running requests in detail to resolve contention issues. Request trending identifies increased periods of issues contention and poor performance of applications for users.
SQL Server Performance
Insight into SQL Server performance provides the ability to take action when needed. Alerting based on baseline thresholds provides intelligent notifications for different applications. A few of the SQL Server metrics provided
- Batch Requests
- Compilations
- Wait Statistics
- Database and Log IO, Size
- Blocked, Long Running, and DeadLocked Requests
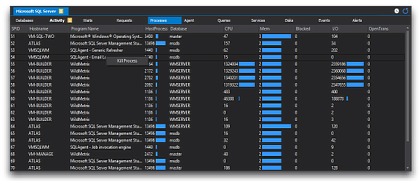
Remediation
SQL Processes can be analyzed and killed if necessary from the console. Additional management script widgets can be configured for additional remediation or actionable tasks to meet your needs.